Data Compare Chart
The Data Compare chart shows the difference between the last two fully completed audits for the selected Business Unit. The five main differences are displayed as segments in the chart. A sixth segment shows the combined total of all other results.
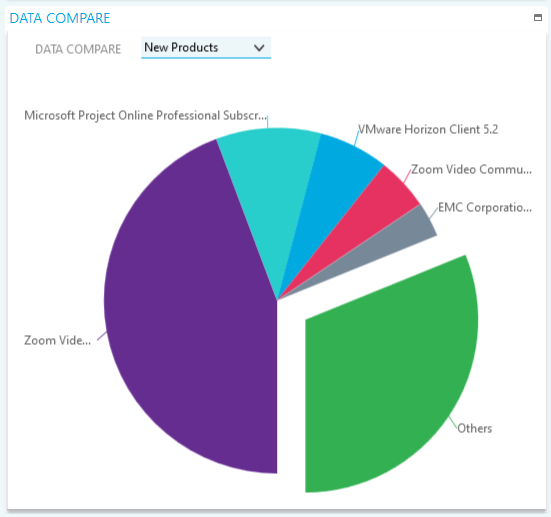
There are three variations of this chart. Click the drop down menu icon change the chart display to represent New Products, Dropped Products or New Installs.
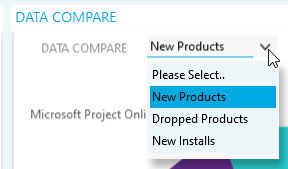
- New Products shows products that were found in the last audit, but not the previous audit. The top five products are shown according to the number of installations. A sixth segment shows a combined total for all other products.
- Dropped Products shows products that were not found in the last audit but existed in the audit before that. The top five products are shown according to the number of installations. A sixth segment shows a combined total for all other products.
- New Installs shows installations of products that existed in the previous audit but have been increased in the last audit.